 |
Hammond Vibrato Scanner |
|
I've been wanting to do a couple of mechanical modules. One is a Hammond Vibrato Scanner and the other is a replica of the Raymond Scott Circle Machine. I've begun work on the Circle Machine and I also built a Jürgen Haible scanner chorus/vibrato module which is an all-electronic version of the Hammond Vibrato Scanner. There is a really nice article on Overhauling and Improving the Hammond M-100 Series Vibrato System at http://www.stefanv.com/electronics/hammond_vibrato_mod.html.
Scanner and Delay Line
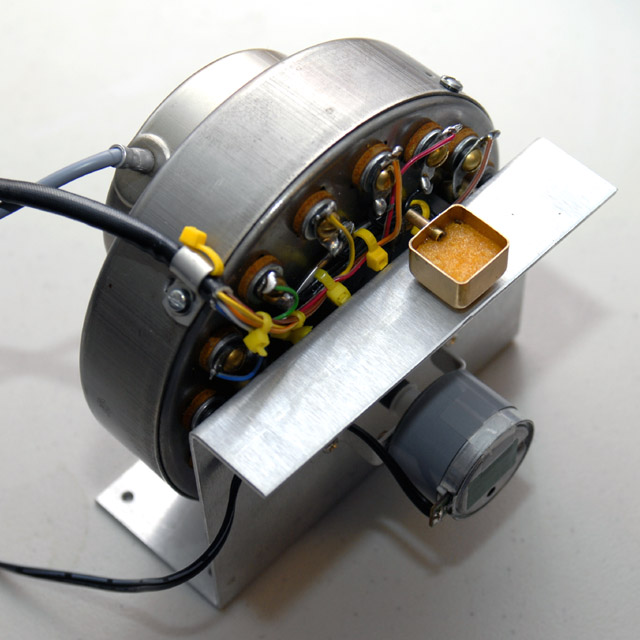
Since I own a couple of Hammond organs, I rebuilt a spare B-3 vibrato scanner and tested it with my modular synthesizer. The scanner is a rotary capacitor used as a sixteen way variable switch to connect taps on a delay line to the output. I made a bracket to mount the scanner and a small DC motor. I used an RF shield as a bathtub and added the brass tube for the four oil threads.
I get asked a lot how I coupled the scanner to the motor. I used an A0-21869-19 scanner. The -19 is important as that scanner comes with a small brass disc drive and not the recessed hole with the gear. My DC motor had a small pulley on it much larger than the short nub of a drive shaft that extended through the brass disc. However I found a small rubber grommet that fit snuggly over the short nub of a drive shaft and the OD of the grommet was just about the same as the OD of the motor pulley. I simply used heat shrink to couple the grommet to the pulley. That provided a flexible drive shaft so the motor doesn't have to be aligned perfectly. I don't know what organs the A0-21869-19 was used on but I suspect it was the E-100/300 series.
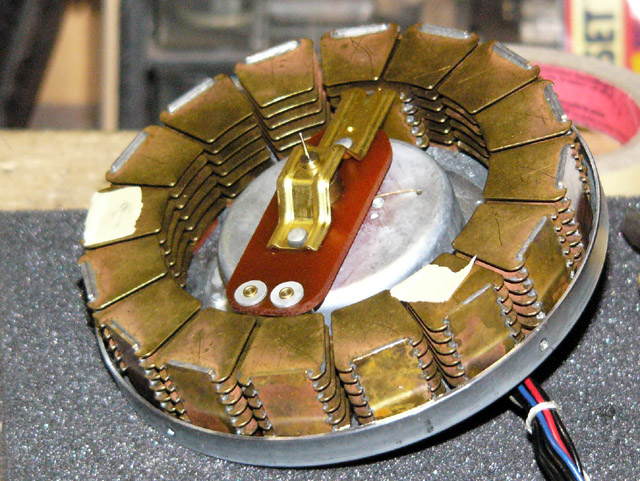
This photo shows the 16 stationary plates and the rotor assembly. The tape indicates the two sections that are shorted and need to be cleaned due to dendrite growth which cause a resistance to ground (one plate had a 14K resistance path). Note the cotton thread coming through the hole to oil the top rotor bearing.
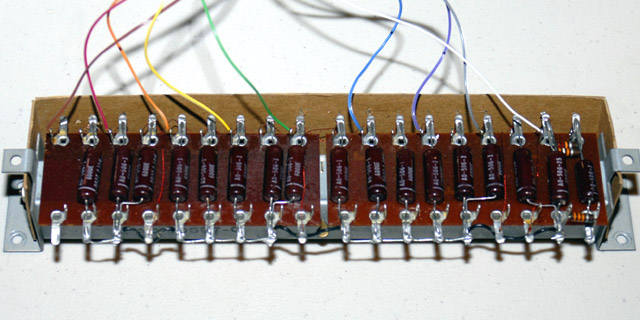
This delay line is one half from a Hammond H-100 organ. The inductors are mounted below the phenolic terminal strips.
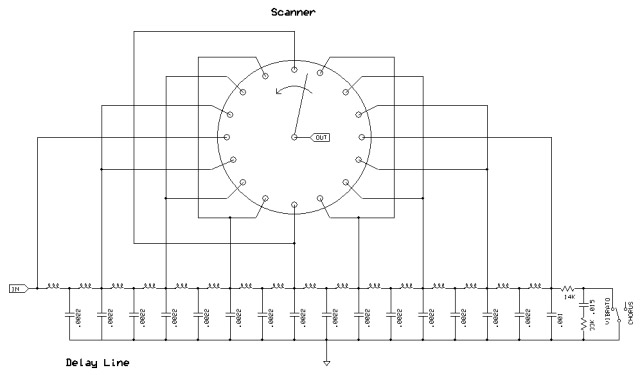
I wired the scanner as the Hammond B-3 V1/C1 setting with sequential delay line taps (using different delay line taps produce alternate vibrato effects). Full size schematic
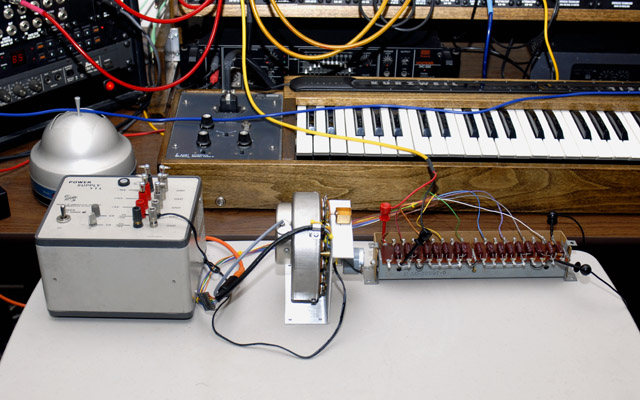
This photo shows my vibrato scanner test setup interfaced to my modular synthesizer.
Sounds
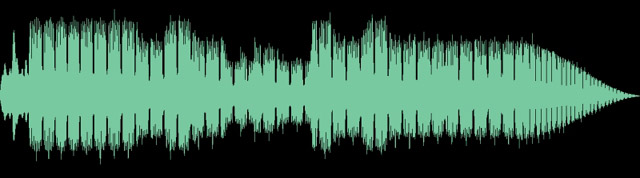
This sample is a triangle wave through the vibrato scanner. I vary the voltage to the motor to start and stop the scanner. Half way through the sample I open the switch to change the effect from vibrato to chorus. Mp3 encoding creates some artifacts so there is also an Ogg Vorbis format sample which sounds a bit better.

Vibrato scanner sample (.mp3 file)
Vibrato scanner sample (.ogg file)
I also tried connecting different VCO waveforms to some of the scanner inputs. This sample is three VCOs connected to scanner sections 3 (saw), 5 (triangle), and 9 (MultiWave sample). Connecting inputs to different scanner sections produces unique audio patterns.
VCO scanner sample (.mp3 file)
Delay Line Measurements
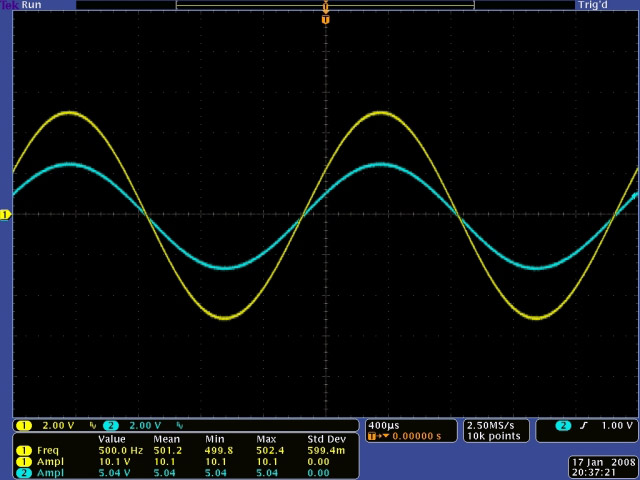
I measured the characteristic impedance of the delay line with a 500 Hz sine wave input to be 14.52 K ohms. The yellow trace is the output of my VCO and the cyan trace is the input to the delay line at 50% amplitude.
The impedance of the delay line, Zo = [L / C]1/2, which calculates L to be 0.463H.
An application note on passive delay lines from Rhombus Industries, Inc.
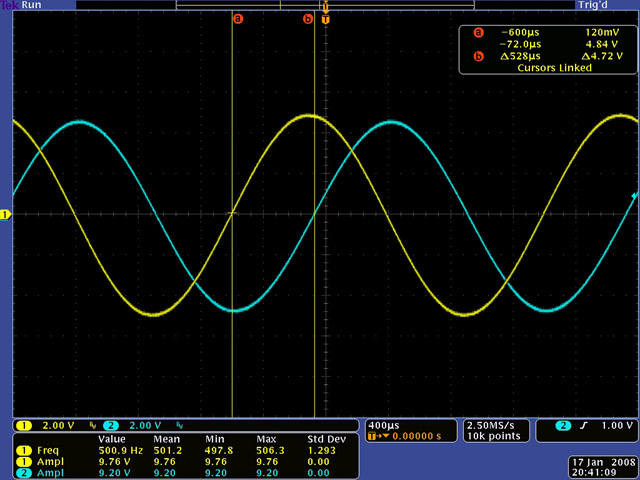
I measured the total delay of the delay line with a 500 Hz sine wave to be 528 µS. The yellow trace is the output of the delay line at the 16th stage.
The total delay, Td = [16L x 16C]1/2, calculates to be 511 µS, well within the part tolerances for the measured delay.
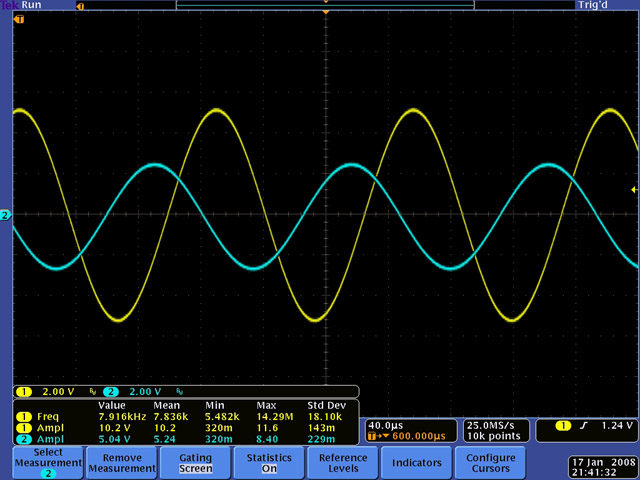
The corner frequency (-3dB) measures 7.9 KHz. The yellow trace is the input to the delay line and the cyan trace is the output of the delay line at the 16th stage.
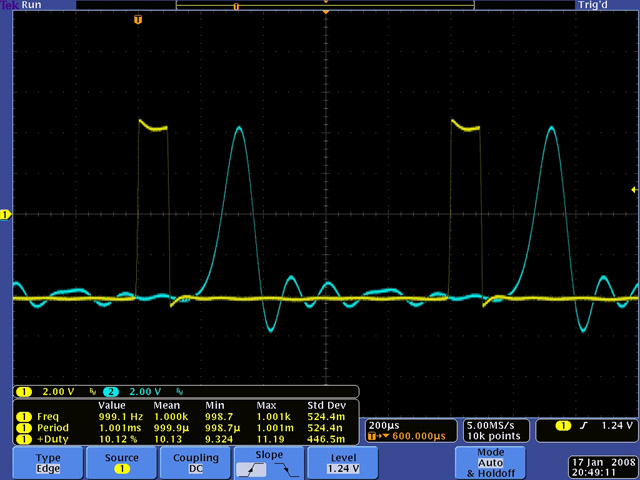
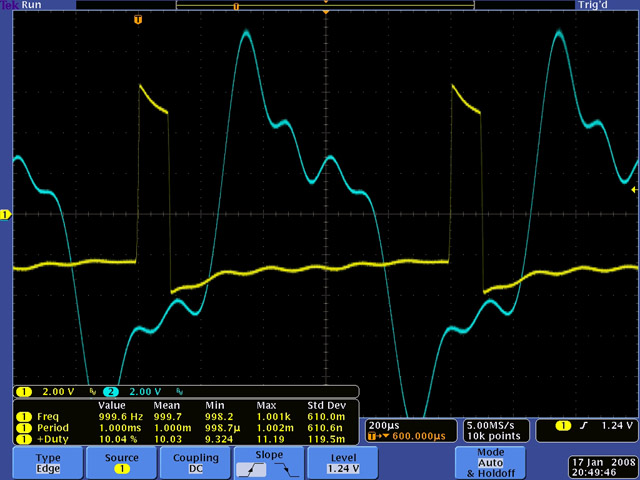
Here is the performance of the delay line with a 1 KHz 10% duty pulse with vibrato termination (R=14K). The yellow trace is the input to the delay line and the cyan trace is the output of the delay line at the 8th stage (center).
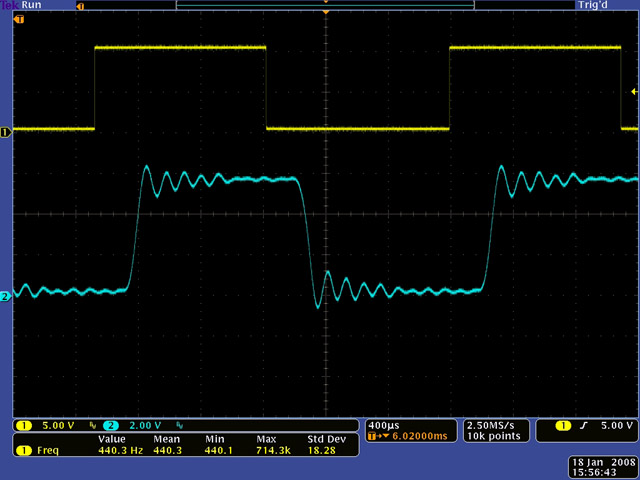
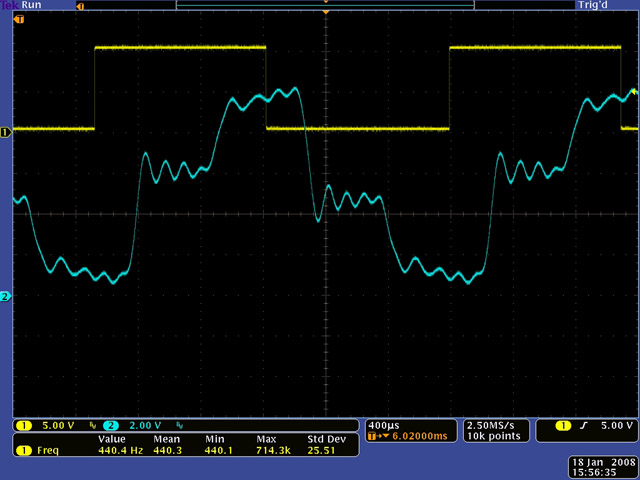
Here is the performance of the delay line driven by a 440 Hz square wave with 14K source impedance and vibrato termination (R=14K). The yellow trace is the input to the delay line and the cyan trace is the output of the delay line at the 8th stage (center). Note the lack of reflections.
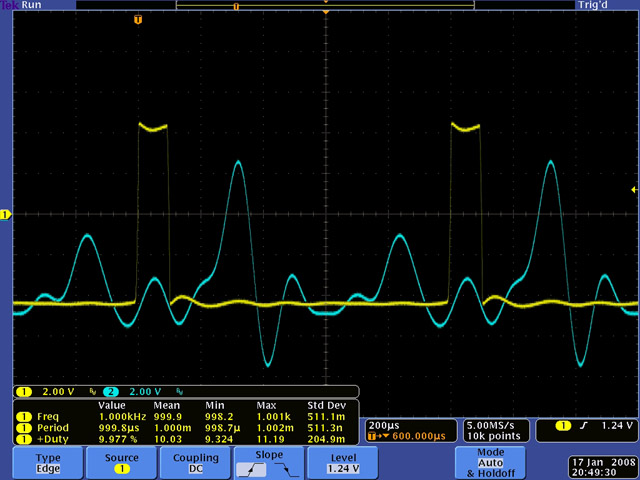
Here is the performance of the delay line with a 1 KHz 10% duty pulse with chorus termination (R=57K6 @ 1 KHz). The yellow trace is the input to the delay line and the cyan trace is the output of the delay line at the 8th stage (center). Note the reflections which generate the chorus effect.
The percent reflection R% = [1 - (1 / (1 + (Zo / 2R)))], calculates to be ~11% at 1 KHz.
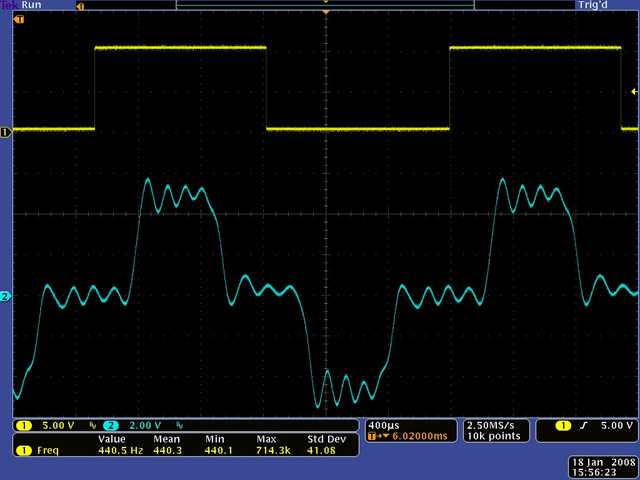
Here is the performance of the delay line driven by a 440 Hz square wave with 14K source impedance and with chorus termination (R=71K1 @ 440 Hz). The yellow trace is the input to the delay line and the cyan trace is the output of the delay line at the 8th stage (center). Note the single large reflection.
Here is the performance of the delay line with a 1 KHz 10% duty pulse with the output shorted (R=0). The yellow trace is the input to the delay line and the cyan trace is the output of the delay line at the 8th stage (center). Note the significant increase in reflections.
Here is the performance of the delay line driven by a 440 Hz square wave with 14K source impedance and with the output shorted (R=0). The yellow trace is the input to the delay line and the cyan trace is the output of the delay line at the 8th stage (center). Since the reflection is the opposite polarity, the resulting waveform is now centered about ground.
I was asked if I had measured the value of the air capacitors in the scanner. I had not but was curious so I decided to measure them both physically to compute the capacitance and as an attenuator in an AC circuit. The AC measurement is probably more accurate than my physical measurement and calculate to a value of 24.5 pF. The following paper details the physical measurements, AC test setup, and capacitance calculations.
Hammond Scanner Measurement paper New
Construction
I mounted the scanner and delay line to a nice base plate and and made a small bracket for the controls. I made a small PWM motor control using a 555 timer so I can vary the speed of the vibrato.
I drive the vibrato scanner with the +/-5 volt signals from my modular synthesizer. I use my Tape Delay Interface preamp to boost the signals back up which has a gain of ~15 and seems to work fine (although I did not measure the recovered signal level).
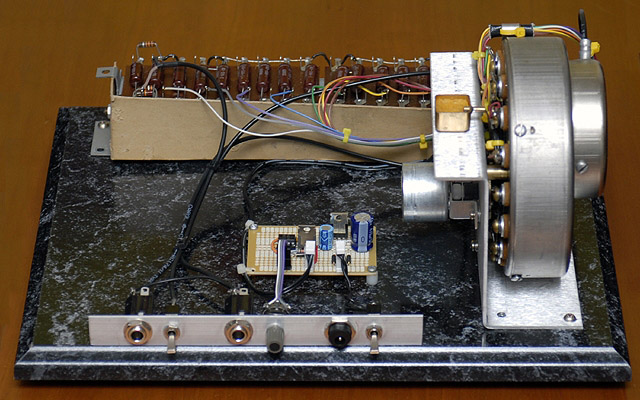
Controls left to right: Output Vibrato/Chorus Input Speed Power On/Off